
Opinion: A new long-term plan; a different scenario?

.
■ By the time you read this opinion piece, our elected councillors have a briefing about the new LTP from council staff involving the different scenario’s they can choose from, writes Peter Minten
I tried to decipher the public available briefing document for this meeting but got a bit lost in all the management jargon and acronyms which are used in it.
Our councillors can choose from two scenarios already pre-cooked by council staff, develop and build their own (so-called Scenario 2) or accept all endorsed gateways which staff calls Scenario 1.
I am not sure what a gateway is; it is not explained in the document, but I assume that they are projects to improve on a current service or introduce a new one driven by new legislation.
Scenario 1 will be the most expensive one with an estimated compounded rates increase of 42.9 percent for the first three years of the LTP.
Scenario 4 is the ‘cheapest’ one with only limited investment in the Rex Morpeth Hub and only 52 gateways asking a 16.8 percent rate increase over the same period. And, assured, that is still well above the inflation expectations.
Yes, the term “affordability” is mentioned in the document as part of the AAA evidence-based prioritisation and scenario modelling. (The other two A’s are Attractiveness and Achievability).
Apart from being used in this example of high-level management blah-blah, affordability is further nowhere to be found in the document, so it won’t be at the front of the mind of our councillors.
So, I will have a go and try to explain what is affordable.
In our district live 38,400 residents. There are 17,277 rateable properties and 14,928 of those receive a rates invoice. Those numbers have not changed much if you compare it with other districts and nationwide.
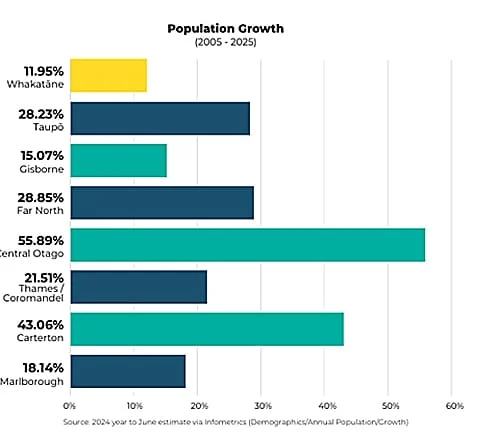
Nationwide, the population growth was 24.8 percent over the same time frame, so it is clear that all those migration surpluses didn’t choose Whakatāne district as their residence. It gets even worse when assessing the economic achievements of our district.
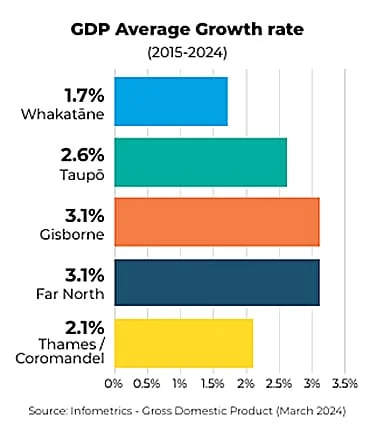
New Zealand as a whole achieved a 2.7 percent average growth in real GDP over the same period.
Again, Whakatāne clearly lags all the others, and you can see they are comparable from a social economic perspective.
This all gives Whakatāne firstly a smaller rate payer basis than the others, but secondly, those who are living here have also less to spend.
Whakatāne GDP per capita sits at $63,000 leading to a median income of $54,300. Nationwide the numbers are according to the World Bank Stats, $80,900 GDP per capita and a median income of $69,836.
Conclusion remains there are not enough of us and secondly, we are collectively too poor to stump up rate increases of which even the most modest choice exceeds inflations expectations by a country mile.
According to the RBNZ, the compounded inflation expectations for the 2027-2029 period is 7.44 percent and that is still well below the 16.8 percent rate rise, the cheapest version, the council has in store for us.
■ (The graphs are taken from an excellent council document, Whakatāne District Local Growth Strategy, in which not a single consultant was involved).